Chapter 42 — Economic Growth and Sustainability
Cambridge International AS & A Level Economics (9708) · Unit 9.2 · 4th edition coursebook
Learning objectives
- explain the difference between actual growth and potential growth in national output
- explain the causes and consequences of positive and negative output gaps
- describe the phases of the business (trade) cycle
- analyse the causes of the business cycle
- explain the role of automatic stabilisers
- evaluate the effectiveness of policies to promote economic growth
- explain the meaning of inclusive economic growth
- analyse the impact of economic growth on equity and equality
- analyse policies to promote inclusive economic growth
- explain the meaning of sustainable economic growth
- explain the difference between using and conserving resources
- analyse the impact of economic growth on the environment and climate change
- evaluate policies to mitigate the impact of economic growth on the environment and climate change.
Key terms
- actual economic growth
- an increase in real GDP.
- potential economic growth
- an increase in the productive capacity of the economy.
- output gap
- a gap between actual and potential output.
- negative output gap
- a situation where actual output is below potential output.
- positive output gap
- a situation where actual output is above potential output.
- business cycle
- fluctuations in economic activity; also known as the trade cycle.
- depression
- a fall in real GDP that lasts several years.
- gig economy
- A labour market based on short-term contracts.
- sustainable economic growth
- Economic growth that does not threaten future generations' ability to experience economic growth.
- climate change
- A change in the weather of a region over a period of time.
- greenhouse gases
- Carbon dioxide, methane, nitrous oxide.
- global warming
- A rise in the temperature of the world's atmosphere arising from the emission of greenhouse gases.
- polluter pays principle
- A policy that makes those responsible for causing damage to the environment pay for that damage.
42.1Actual and potential economic growth
Actual economic growth occurs when output increases. It is sometimes called short-run economic growth. It can come from greater use of resources that are already available — bringing previously unemployed labour and idle capital into production — or from using more resources. On a production possibility curve (PPC), actual growth is shown by moving from a point inside the curve to a point closer to or on the frontier (see Figure 42.2). On an AD/AS diagram, an increase in aggregate demand in an economy with spare capacity raises real GDP without lifting the long-run aggregate supply curve (see Figure 42.3).
Potential economic growth is an increase in the productive capacity of the economy. It is sometimes called long-run economic growth. On a PPC, potential growth is shown by an outward shift of the whole curve; on an AD/AS diagram, the long-run aggregate supply curve shifts to the right, indicating that the economy is now capable of producing more at any given price level (see Figure 42.4). For potential growth to translate into higher output, the new productive capacity must be put to use — actual growth must take place alongside the rise in capacity. The two kinds of growth are most powerful when they happen together: the LRAS curve shifts right, aggregate demand rises to match it, and real GDP rises without putting upward pressure on the price level (see Figure 42.5).
Key concept link — Progress and development
Actual economic growth combined with potential economic growth may increase progress and development. This is because such a combination can increase output, income and the quantity and quality of resources.
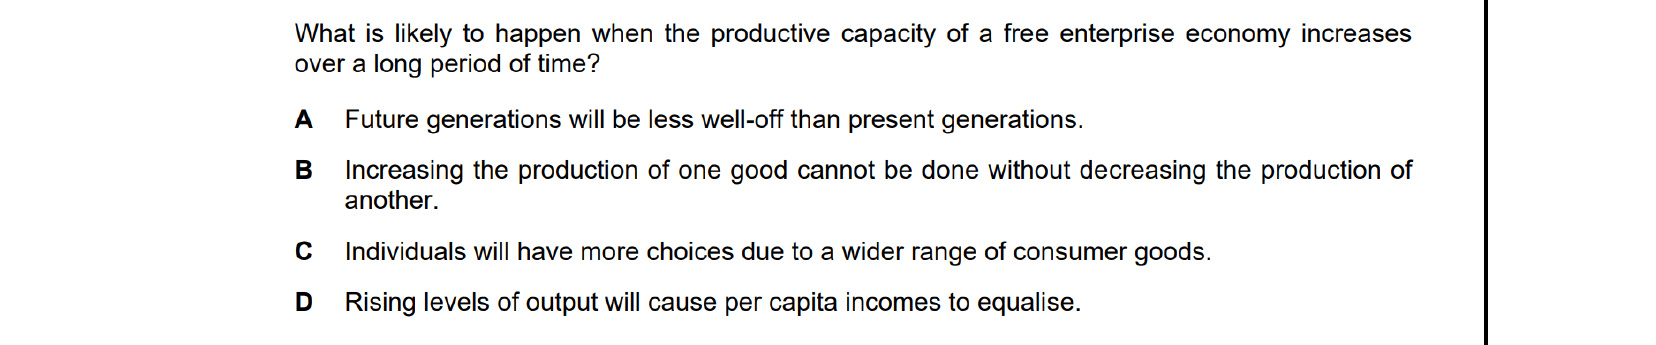
A sustained rise in productive capacity shifts the PPC outwards. The economy can now produce more of every good and a wider variety of goods, so consumers enjoy more choice — option C. Options A and D contradict the gains from growth, while B describes a static, on-the-frontier trade-off, not the expansion of capacity.
42.2Positive and negative output gaps
The difference between actual output and potential output is the output gap. A negative output gap arises when actual output is below potential output. The cause is a lack of aggregate demand: there are unemployed resources and the economy is producing less than it could. On an AD/AS diagram (see Figure 42.6) this shows up as an equilibrium real GDP that lies to the left of the long-run aggregate supply curve, with short-run aggregate supply intersecting aggregate demand at a point below full employment output.
A positive output gap occurs when an economy is producing more than its maximum sustainable potential. This is possible in the short run because, in response to high aggregate demand, machinery can be run continuously without proper maintenance, and workers can be persuaded to work long hours of overtime. But this cannot last: machines eventually need servicing and repair, and workers want to cut back their overtime hours. On the diagram, equilibrium real GDP lies to the right of the LRAS curve (see Figure 42.7).
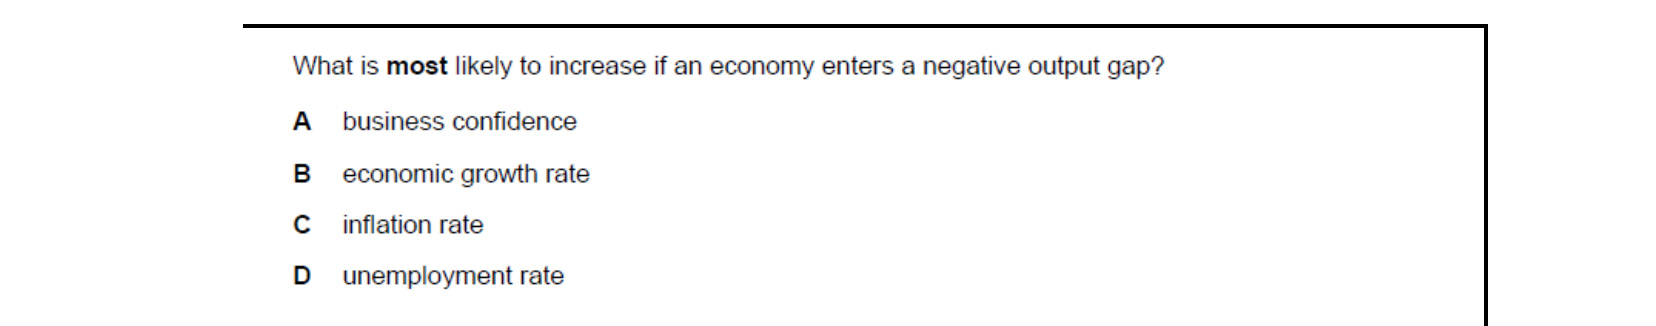
A negative output gap means actual GDP is below its trend level — there is spare capacity and aggregate demand is weak. The variable that rises in this situation is the unemployment rate (option D), as firms cut labour use; business confidence, growth and inflation all tend to fall.
42.3The business cycle
Output gaps arise during the course of a business cycle. Economies can grow smoothly over long stretches, but there are also periods of noticeable fluctuation in real GDP around its trend. These swings — sometimes called the trade cycle or the economic cycle — are fluctuations of actual output around the trend growth in productive potential (see Figure 42.8).
The phases of the business cycle
The cycle usually has four phases:
- The upturn — also called expansion. The economy is growing more rapidly. Households and firms are optimistic. Consumption rises with expectations of higher income. Higher profits and increased bank lending boost investment, including in higher-risk projects. Employment rises. A rapid upturn can be described as an economic boom.
- The peak — the top of the cycle and a turning point. The economy is running with a positive output gap; high aggregate demand drives inflation and balance of payments difficulties.
- The downturn — the growth rate falls and may turn negative. Confidence fades. Saving rises, some high-risk firms go out of business and net investment falls.
- The trough — the bottom of the cycle, where aggregate demand is weakest. The economy may be in a recession or, more seriously, a depression. There is a negative output gap.
Trend real GDP normally rises over time as each year brings improvements in education and advances in technology, so the cycle oscillates around an upward-sloping trend.
The causes of the business cycle
There are two broad explanations: fluctuations in aggregate demand and fluctuations in aggregate supply.
Aggregate demand may vary sharply because of changes in business confidence. Optimistic firms invest more; that investment is an injection into the circular flow, and the multiplier magnifies its effect on GDP. Higher GDP then prompts further investment via the accelerator. The interaction of multiplier and accelerator can produce a large rise in aggregate demand. When pessimism takes hold, both forces work in reverse, producing a downward spiral. Changes in the money supply can also drive fluctuations in aggregate demand: if the money supply grows faster than output, consumption and investment are both likely to rise. There may also be political cycles, with a government raising spending and cutting taxes before an election to win popularity, then introducing contractionary fiscal and monetary policies after the election to deal with the demand-pull inflation those earlier actions have caused.
Large swings in aggregate supply come from supply-side shocks. Positive shocks include major technological advances that raise productivity and reduce production costs. Negative shocks include sharp rises in commodity prices, natural disasters and pandemics, any of which can push many countries into recession at the same time.
The role of automatic stabilisers
Automatic stabilisers offset fluctuations in economic activity. They reduce the rise in GDP during a boom and reduce the fall in GDP during a recession. The mechanism works through aggregate demand. During a boom, households' and firms' incomes rise sharply, but progressive income tax and corporate tax rates skim off a larger share of that extra income — the rise in consumption and investment is therefore dampened. During a recession, government spending on welfare benefits rises because more households need state support, which props up consumption. The combination of tax revenue rising automatically in the upturn and benefit spending rising automatically in the downturn flattens the business cycle.
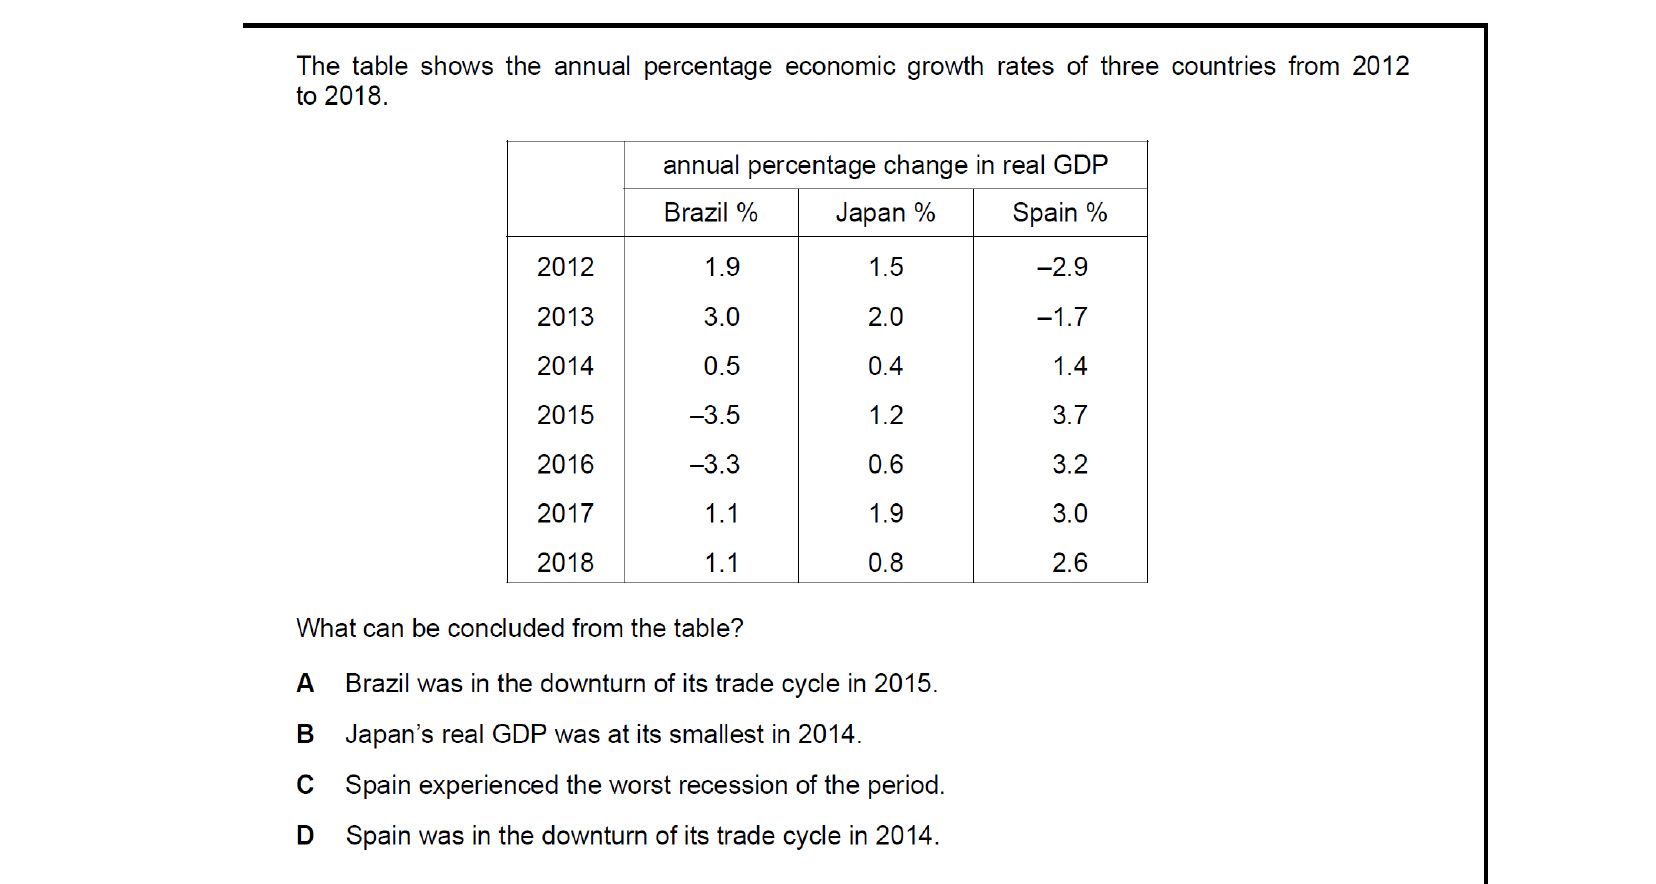
A downturn is the phase in which the growth rate is falling and the economy is moving from expansion into contraction. Brazil's growth fell from 0.5% in 2014 to −3.5% in 2015 — a sharp deceleration into negative growth — which fits the downturn phase of the business cycle, so option A is correct.
42.4Policies to promote economic growth
To promote actual economic growth — and so close a negative output gap — a government will try to raise aggregate demand using expansionary fiscal policy, expansionary monetary policy, or both. For example, a cut in the standard rate of income tax leaves households with more disposable income, which raises consumption. Higher consumption encourages firms to expand output, provided there is spare capacity in the economy.
The risk is that the policies either do too little or too much. If households and firms are worried about future prospects they may be reluctant to spend even with extra disposable income, so the rise in aggregate demand falls short. If, on the other hand, the government underestimates the multiplier, it may inject too much spending or cut taxes too far. The result will be actual economic growth but also demand-pull inflation.
To promote potential economic growth, the government has to encourage an increase in aggregate supply, using supply-side policy tools. Subsidies for firms to train workers, for example, can raise productivity and so lift productive capacity. Supply-side policies are not guaranteed to work — workers may be trained in skills that turn out not to be in demand — but in practice higher government spending on training schemes usually does raise productivity. Because supply-side policies typically involve higher government spending, they tend to add to aggregate demand too, so they can promote actual and potential growth simultaneously.
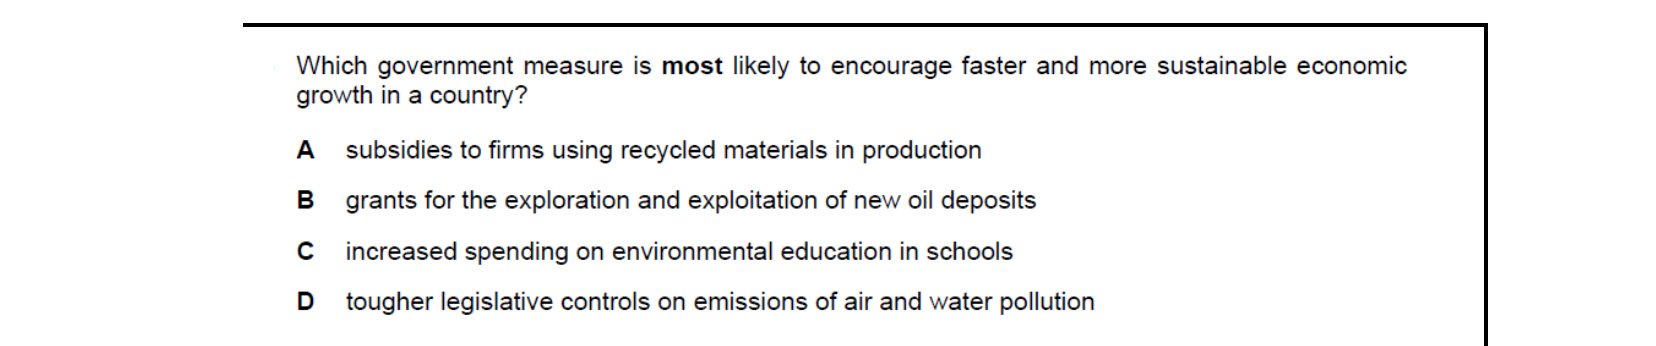
Sustainable growth needs measures that both raise output and conserve natural resources. Subsidies to firms using recycled materials (option A) directly cut the use of virgin resources and waste, supporting growth while protecting the environment. Exploring new oil deposits encourages depletion; education and tougher regulation help sustainability but do less to accelerate growth.
42.5Inclusive economic growth
Inclusive economic growth means economic growth that allows everyone in an economy to benefit from it. The widely used OECD definition describes it as 'economic growth that is distributed fairly across society and creates opportunities for all'.
There are two key dimensions to what 'distributed fairly' implies. The first is a monetary dimension: all groups in society should experience a rise in real income as the economy grows. The second is a non-monetary dimension: all groups should also see improvements in things such as healthcare, education and housing.
Creating opportunities for all means generating more jobs, opening up better working conditions across the labour force, and ensuring that everyone — regardless of gender, ethnicity or background — has the opportunity to live safely and to participate in the economy.
Impact of economic growth on equity and equality
In some cases economic growth has been accompanied by greater equity and a more even distribution of income; in many other cases, the benefits of growth have not been shared evenly, or, it could be argued, fairly. Economic growth involves structural change: new industries appear while others disappear. Workers who are occupationally or geographically immobile may become unemployed because the skills they have or the area in which they live no longer match the new pattern of demand for labour.
Growth can also be accompanied by a widening pay gap. Senior executives and the owners of capital may capture much of the additional income generated, while real pay for the average worker grows much more slowly — or not at all. The rise of the gig economy has added to this pattern: more workers are employed on short-term contracts, often with few rights and no guaranteed working hours. At the global level, many decades of economic growth have been associated with widening income inequality between the richest groups and the rest of the world's population.
It is worth remembering that equality and equity might conflict. It might be seen as unfair if everyone is paid the same when some work harder or have more talent than others. 'Fairly distributed' growth does not mean that all incomes must be identical; it means that opportunities and rewards should reflect effort and contribution rather than characteristics such as gender, place of birth or family background.
Policies to promote inclusive economic growth
Policies that aim to spread the benefits and opportunities created by economic growth more evenly include the following:
- Redistribution of income using progressive taxes on higher incomes combined with transfer payments to low-income households.
- Improved access to high-quality education across the whole population, which raises employment opportunities and pay over the long run.
- A relatively high national minimum wage to ensure that those in work can earn enough to enjoy a reasonable standard of living.
- Anti-discrimination legislation so that no group is excluded from the labour market or from the benefits of growth.
- Improvements in transport and communication links to reduce the geographical immobility of labour and to narrow regional differences in income and employment.
- Trade union legislation that gives trade unions greater power to protect workers' pay and conditions.
- Legislation against slavery and child labour to ensure that vulnerable groups are not exploited as the economy grows.
Key concept link — The role of government / equality and equity
Government policy measures can be used to try to ensure that the benefits of economic growth are spread relatively evenly and fairly among the country's population.
42.6Sustainable economic growth
Sustainable economic growth is economic growth that can continue over time. Achieving it requires a deliberate effort to balance economic, social and environmental objectives. Social divisions, lack of access for some groups to good-quality education, housing and healthcare, and damage to the environment can all threaten an economy's ability to keep raising output in the long run.
Key concept link — Progress and development
If an economy can achieve sustainable economic growth, there can be advances in the quality of people's lives that can continue over a long period of time.
Using and conserving resources
Using natural resources now — for example by extracting fossil fuels, felling timber, or expanding fishing — can raise output and create jobs in the short run. Higher output may also boost exports, improving the current account on the balance of payments, and generate additional tax revenue that can be reinvested in infrastructure or education and so further support growth.
There are, however, important arguments for conserving resources. Maintaining rainforests and wildlife reserves can attract tourism, helping to support a different kind of long-run income. Forests absorb carbon dioxide, helping to limit climate change. Conserving resources also leaves them available for future generations and may allow them to be sold later, when scarcity has driven prices higher.
A number of factors influence the decision to use or conserve resources:
- Future demand. If demand for the product is expected to fall — for example, as alternatives emerge — there is a stronger case for using the resource now.
- Renewability. Where the resource is non-renewable, any revenue earned from using it now should be invested in developing other industries so that growth can continue once the resource is exhausted.
- Comparative advantage now versus the future. A country may currently lack the technology or infrastructure to exploit a resource profitably, but it may gain that advantage in the future, in which case conservation has a strong case.
- Debt pressures. Countries with serious debt problems may feel forced to use a resource now to service their debts, even when conservation would be the better long-run choice.
Key concept link — Scarcity and choice
Scarcity and choice are important concepts in assessing whether to conserve or use resources. The reason why a choice has to be made is because resources are limited.
It is worth remembering that resources which appear renewable, such as fish stocks or forests, can become effectively non-renewable if they are overexploited beyond the rate at which they can regenerate.
Impact of economic growth on the environment and climate change
Economic growth can damage the environment and accelerate climate change across all three production sectors:
- Primary sector. Keeping more livestock raises emissions of methane and puts more pressure on scarce clean water. Crops produced with chemical fertilisers emit nitrous oxide. Clearing rainforest for farming destroys biodiversity and removes carbon-absorbing forest cover. Large-scale fishing can collapse fish stocks. Mining can pollute nearby rivers and contaminate land with heavy metals such as arsenic and mercury.
- Secondary sector. Higher manufacturing output usually means burning more fossil fuels — coal for steel plants and electricity, oil for petrochemicals — which raises carbon dioxide in the atmosphere.
- Tertiary sector. The growth of services is not free of environmental impact. Expanding tourism, for example, means more flights (generating greenhouse gases) and pressure on natural beauty spots and coral reefs.
The consumption of what is produced creates further problems. More vehicles on the world's roads add to air and noise pollution. Household waste, especially plastic, accumulates in landfills and oceans because it can take centuries to degrade.
The accumulation of greenhouse gases is the main driver of global warming and the wider climate change it produces. Growth, however, can also improve environmental conditions if it is directed towards cleaner energy sources, more efficient technologies, and the planting of more trees to absorb carbon dioxide.
Policies to mitigate the impact of growth on the environment
A range of policies can reduce the environmental costs of economic growth:
- Subsidise cleaner sources of energy — for example wind, solar and the planting of trees. Subsidies come at an opportunity cost and do not always encourage the most efficient use of funds.
- Provide information on the damage that certain activities cause. Governments increasingly use nudge theory to design how this information is presented so as to change behaviour.
- Pass legislation to ban or restrict particular activities — for example bans on the sale of single-use plastic bags. Laws are clear and enforceable but are a blunt instrument, and enforcement itself has a cost.
- Tax firms that pollute, based on the polluter pays principle: the tax internalises the external cost, pushing the market closer to the socially optimum level of output, and the revenue can be used to compensate those harmed. The risk is that the tax may be set too high or too low because the environmental cost is hard to estimate. The tax can also be regressive, and if other countries do not impose a similar tax, polluting production may simply relocate abroad rather than fall overall.
- Use pollution permits (see Section 38.1). A government sets a cap on the total amount of pollution allowed, issues tradable permits up to that cap, and lowers the cap over time. Firms that pollute below their allocation can sell permits to others, so cleaner firms gain a cost advantage and capture a larger share of the market. Permit revenue can be used to fund the development of cleaner energy.
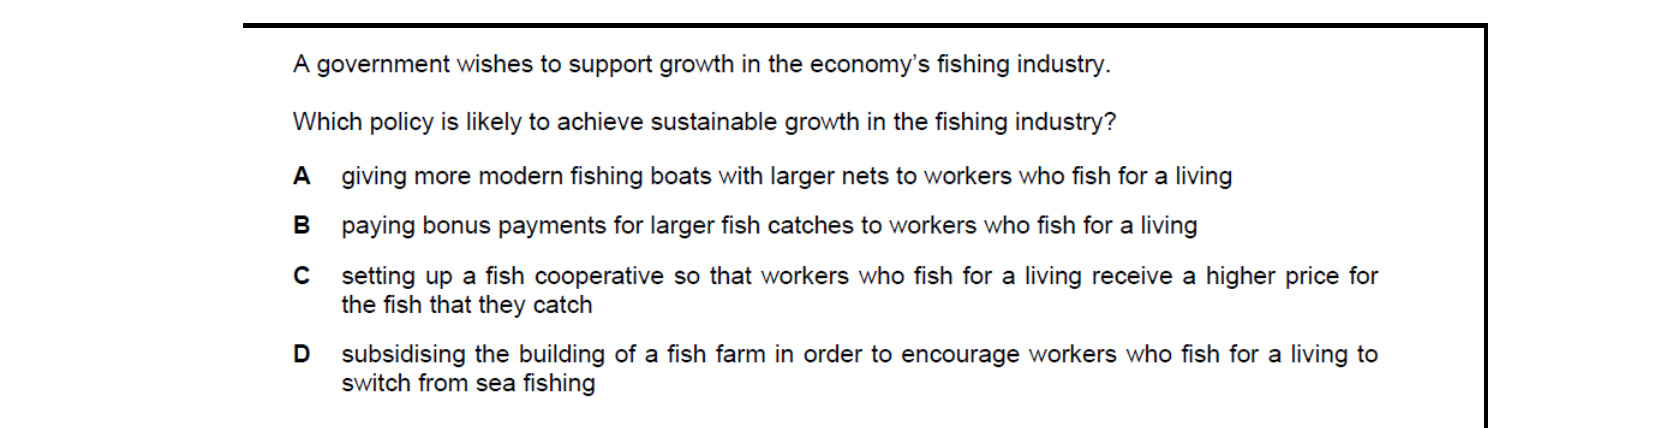
Sustainable growth in fishing means avoiding overexploitation of wild stocks. Subsidising the building of a fish farm so workers switch from sea fishing (option D) eases pressure on the natural fishery while still raising output. The other options all intensify fishing of the existing stock, which is not sustainable.
End-of-chapter practice
Past-paper questions from CIE 9708. Pick A, B, C or D. Answers are saved on this device — press Download report (PDF) at the top to save them.
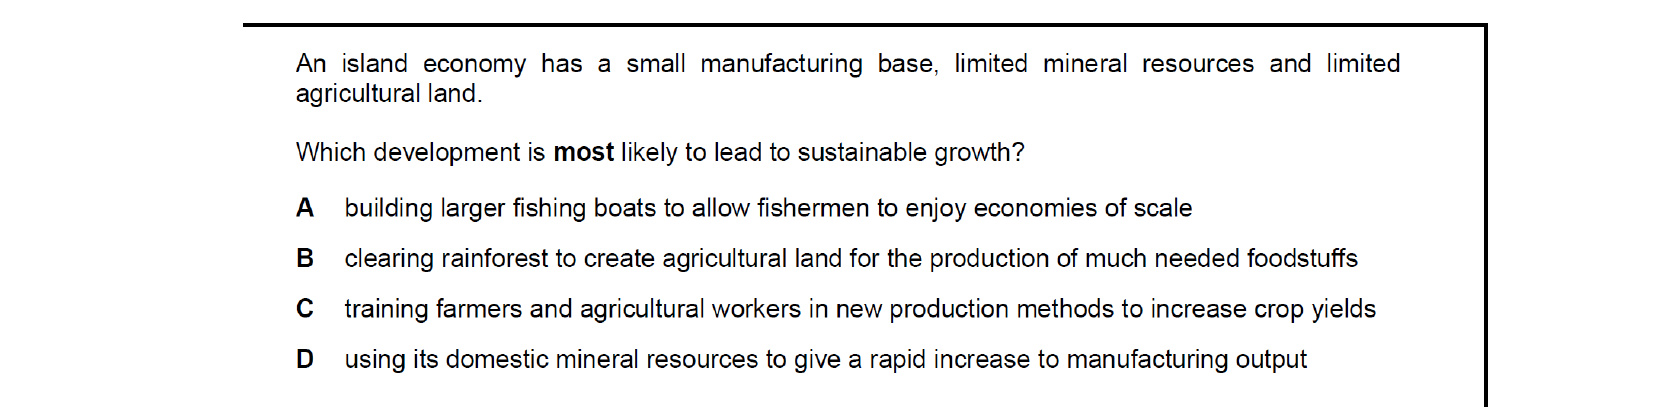
With limited land and minerals, sustainable growth requires raising the productivity of existing resources rather than exploiting them more intensively. Training farmers and agricultural workers to increase crop yields (option C) achieves this; the alternatives (bigger fishing boats, clearing rainforest, depleting minerals) all deplete the country's limited natural stock.
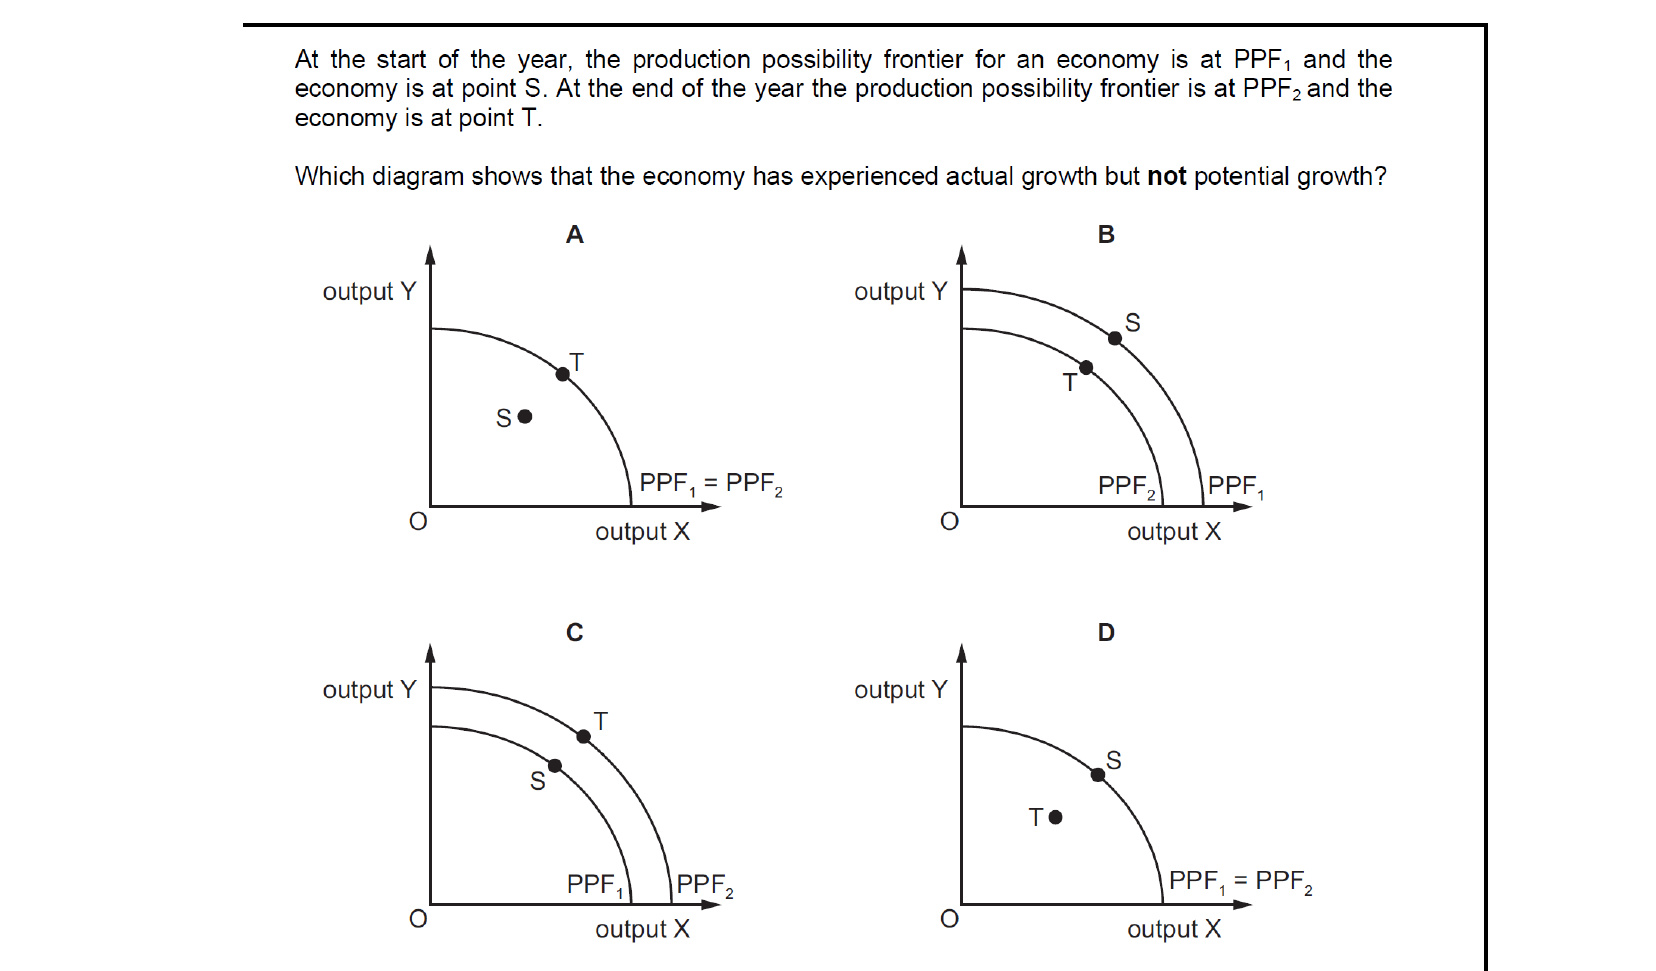
Actual growth uses up existing slack — the economy moves from a point inside the PPC to a point on the same PPC. Potential growth would shift the PPC outwards. The diagram showing point S inside PPC1 moving to T on the same PPC1 (option A) therefore depicts actual growth but no change in potential.
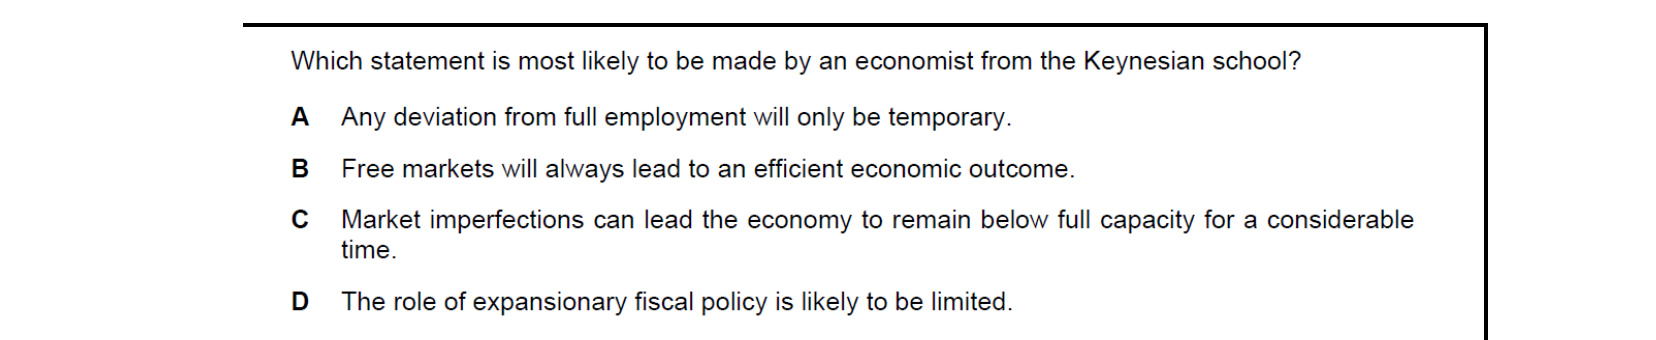
Keynesians argue that wages and prices are sticky and that aggregate demand can be persistently deficient, so market imperfections can leave the economy stuck below full capacity for a long time (option C). Statements A, B and D reflect classical/monetarist views and would not be made by a Keynesian.
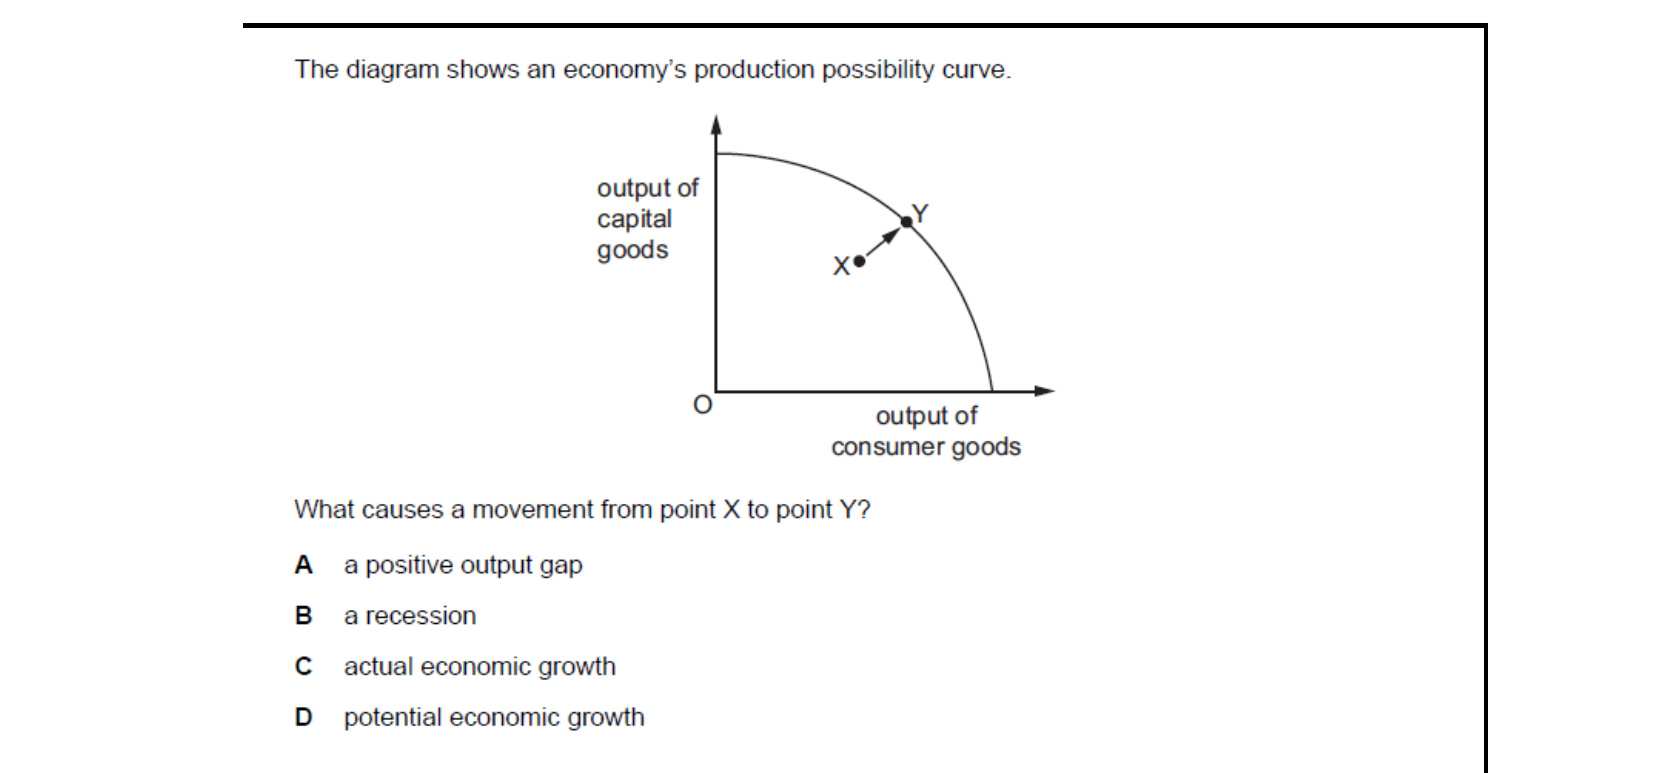
If X lies inside the PPC and Y lies on it, the move from X to Y represents bringing previously idle resources into use without expanding the frontier. This is actual economic growth (option C) — the economy is producing more without any rise in productive capacity, which would have shifted the PPC itself.
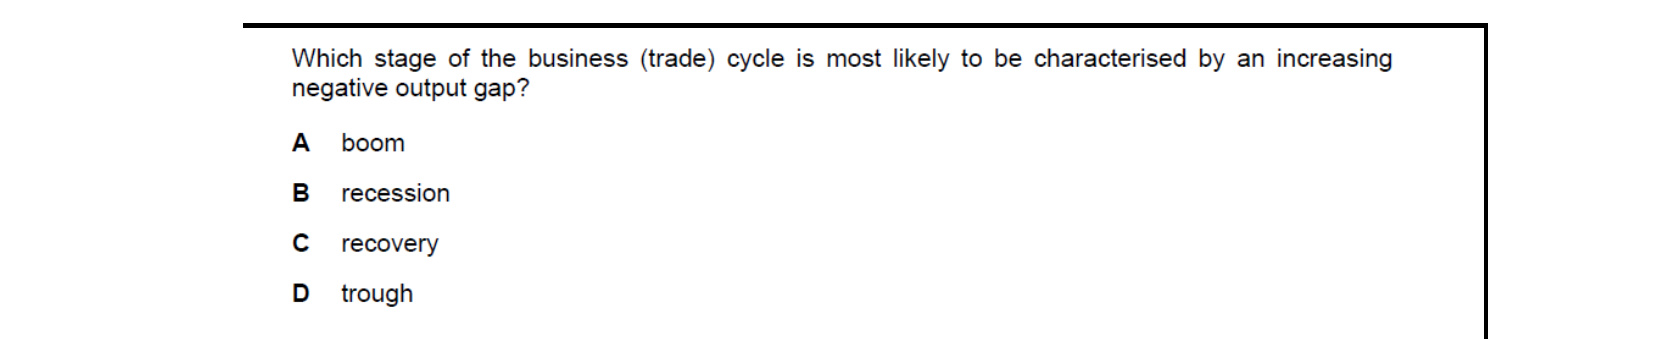
During a recession real GDP is falling while potential output keeps growing, so the gap between actual and potential GDP widens in a negative direction. The phase most associated with an increasing negative output gap is therefore the recession (option B); the trough is the bottom, recovery is closing the gap, and a boom is associated with a positive gap.
Attempt the practice questions above to build your score.
Self-evaluation checklist
After studying this chapter, you should be able to:
- Explain the difference between actual growth and potential growth in national output
- Explain the causes and consequences of positive and negative output gaps
- Describe the phases of the business (trade) cycle
- Analyse the causes of the business cycle
- Explain the role of automatic stabilisers
- Evaluate the effectiveness of policies to promote economic growth
- Explain the meaning of inclusive economic growth
- Analyse the impact of economic growth on equity and equality
- Analyse policies to promote inclusive economic growth
- Explain the meaning of sustainable economic growth
- Explain the difference between using and conserving resources
- Analyse the impact of economic growth on the environment and climate change
- Evaluate policies to mitigate the impact of economic growth on the environment and climate change
- Define inclusive economic growth.
- Analyse the impact of economic growth on equity and equality.
- Discuss policies to promote inclusive economic growth.
- Define sustainable economic growth.
- Analyse the impact of economic growth on the environment and climate change.
- Discuss policies to mitigate the environmental impact of economic growth.
Want more practice? Drill this chapter's past-paper MCQs (63 questions) →